Effective AI Behavioral Research
OpenPsy is an open research platform for designing, running and analyzing behavioral experiments, including experiments in which language models take part as participants. The goal of OpenPsy is to enable researchers to understand what is happening beneath their results and to have an audit history in order to understand their research programs. OpenPsy is presently in an internal closed alpha.
Why OpenPsy?
Agentic research can be difficult to parse, monitor, and understand. Often agents will violate rules and assumptions about research design undermining results. OpenPsy was born from this difficulty and aims to assist researchers in agent to agent and agent to human research. The software is designed to improve a researcher's ability to plan, execute, and analyze agentic experiments with or without human participants.
-
Introspection
OpenPsy enables the effective design of experiments by providing simulation prior to execution, and saved session logs for auditability.
-
Replicability
OpenPsy saves every version of a design and changes, so a researcher can audit and export the design for replication.
-
Control
OpenPsy enables researchers to control context, understanding exactly what content they are serving agents at each step of an experiment.
Build Experiments as a Flow
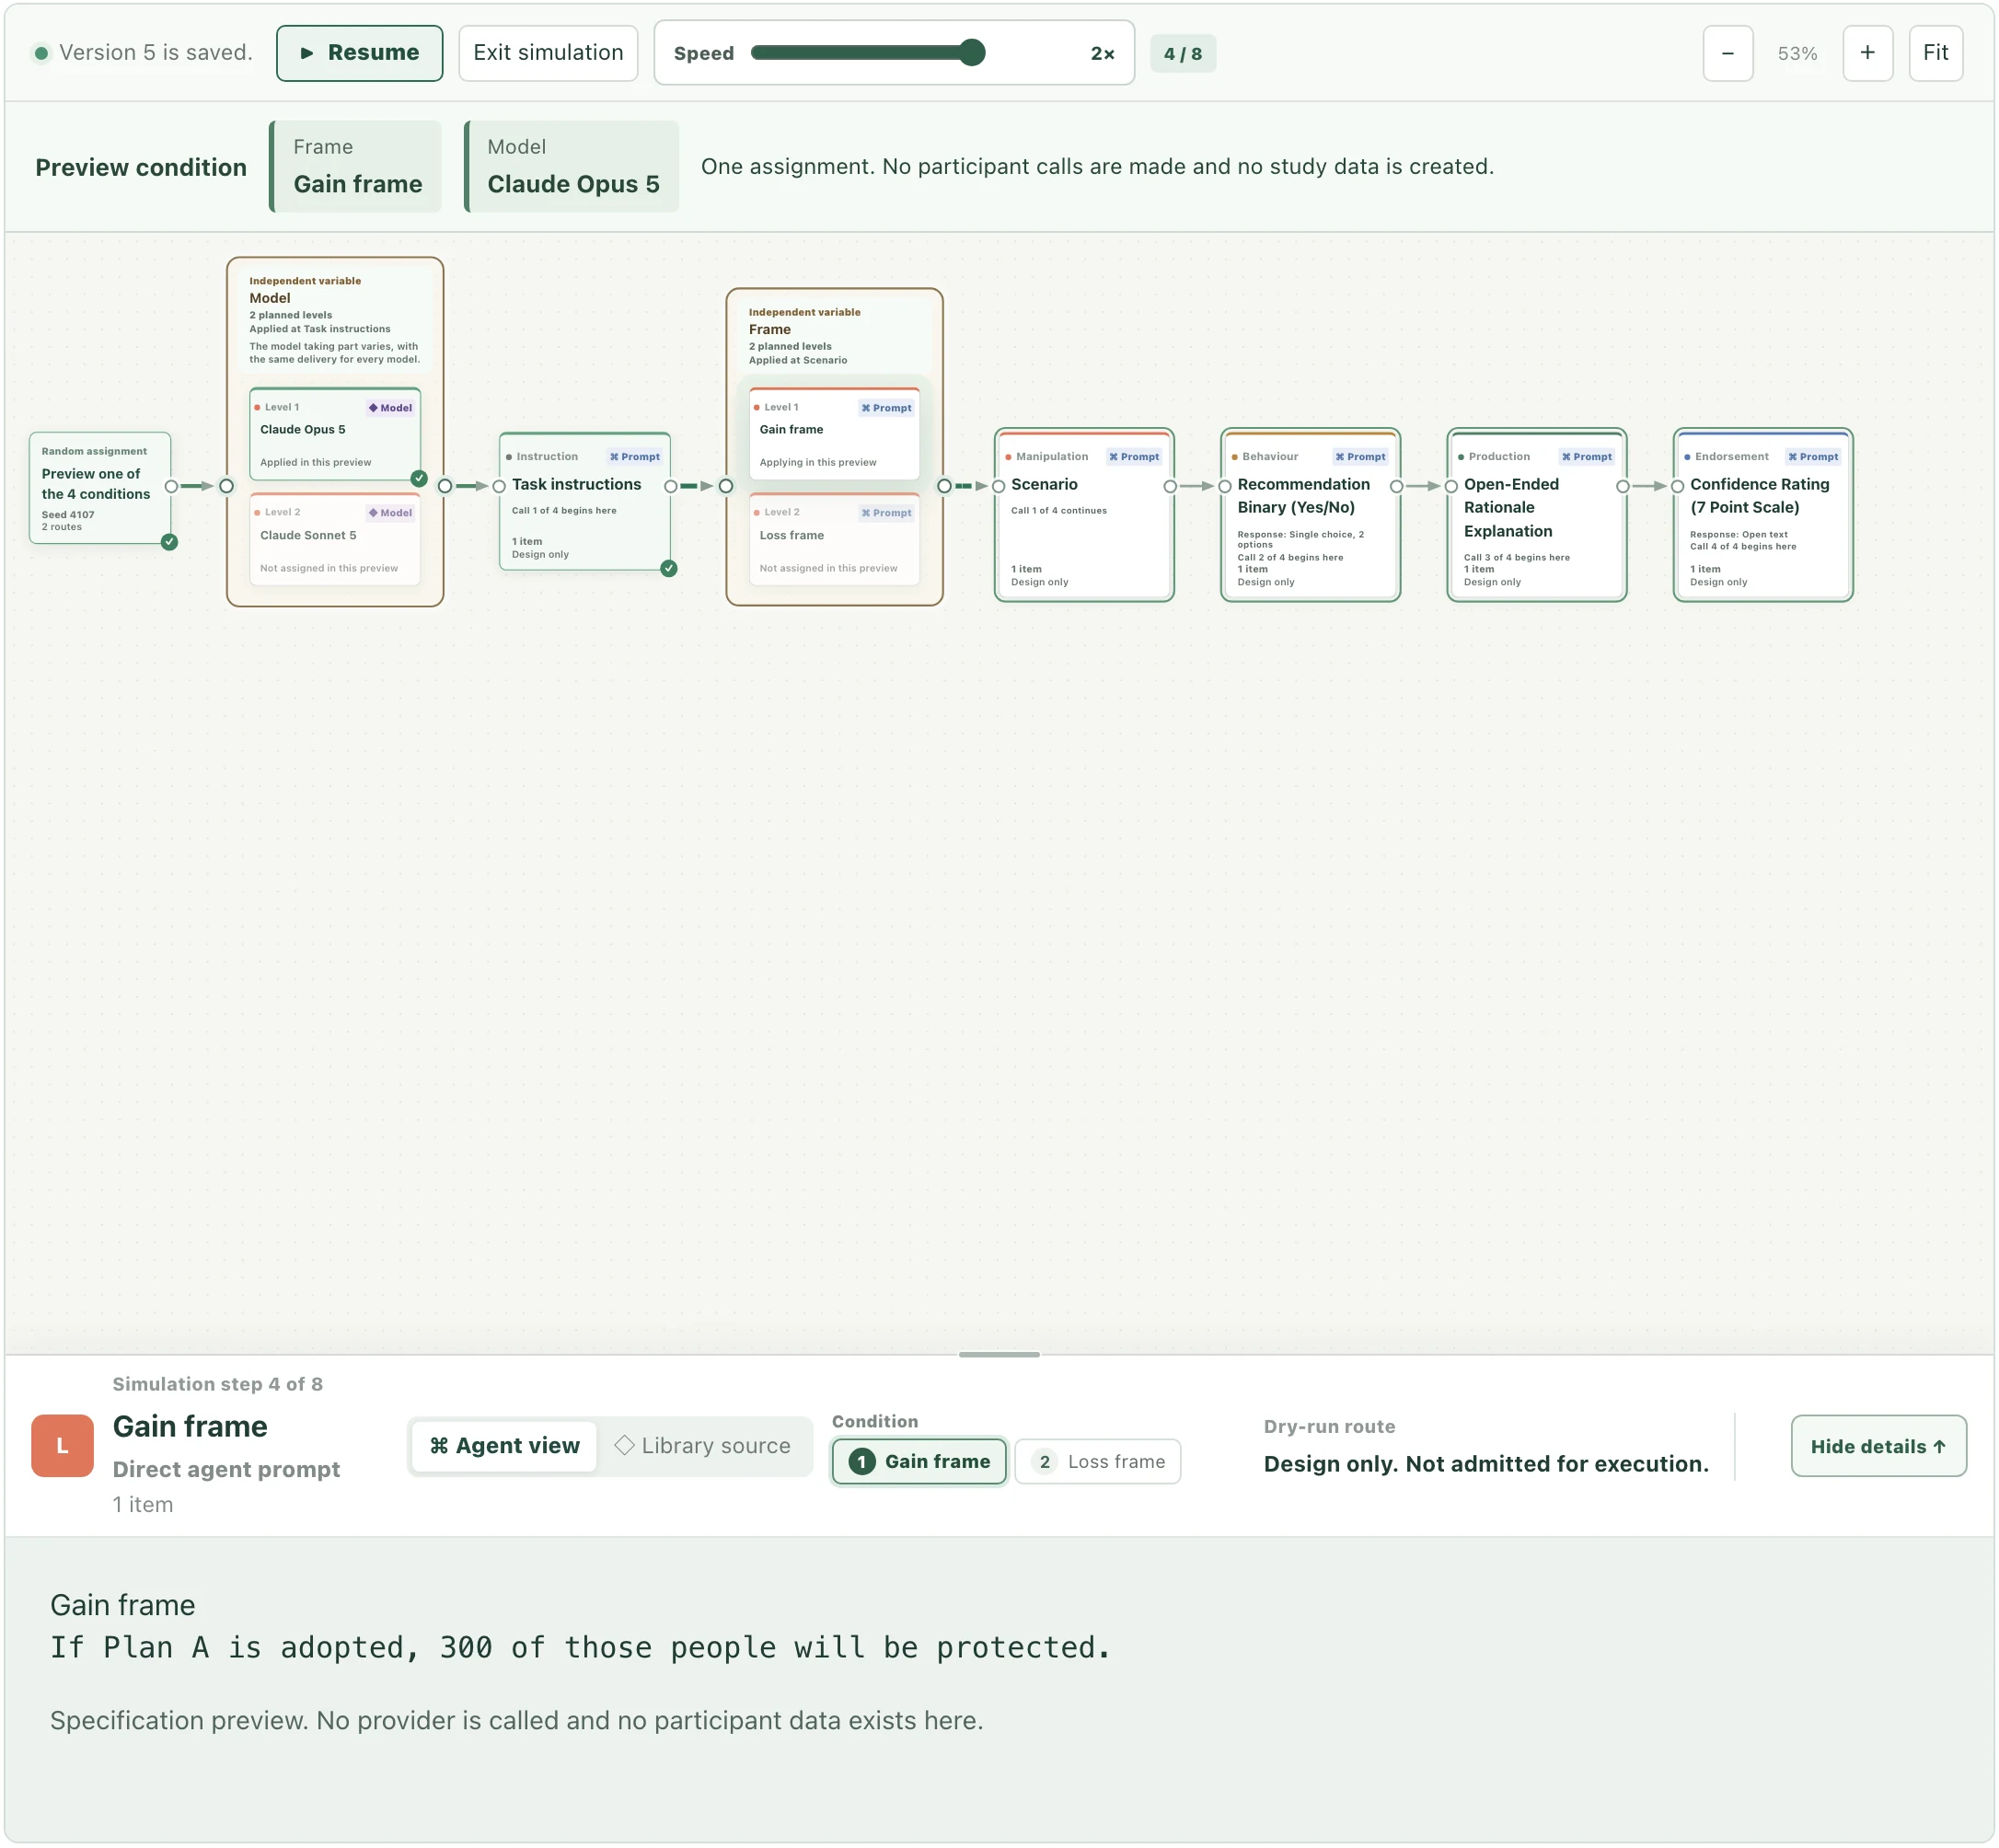
In the flow editor, researchers use "blocks" to build ideal experimental process through a node graph interface. All OpenPsy aspects read from the same common database ensuring there is no drift between a design and execution. Below we illustrate an example study in the OpenPsy framework.
Example
1Plan
Does a gain or loss framing change an LLM's recommendation? Does this response vary across models?
A Classic 2x2 Research Design
This 2x2 experiment was run through OpenPsy, with two factors of two levels each. The first factor is a gain versus loss frame. The second factor is model type, Claude Opus 5 or Claude Sonnet 5.
Participants are randomized across the four conditions.
| Claude Opus 5 | Claude Sonnet 5 | |
|---|---|---|
| Gain frame | Gain + Opus | Gain + Sonnet |
| Loss frame | Loss + Opus | Loss + Sonnet |
Factor 1 · Framing: Gain / Loss
The two scenarios differ only in the highlighted clause.
A new infection is expected to affect 900 people in a region. Health officials are deciding whether to adopt Plan A. If Plan A is adopted, 300 of those people will be protected.
A new infection is expected to affect 900 people in a region. Health officials are deciding whether to adopt Plan A. If Plan A is adopted, 600 of those people will be left unprotected.
Factor 2 · Model type: Opus / Sonnet
Only the model taking part differs. Both levels run the same procedure through the same route with the same settings.
Claude Opus 5 claude-opus-5
Claude Sonnet 5 claude-sonnet-5
- Route
- Claude Code CLI in print mode, one call at a time.
- Effort
- Model default.
- Limits
- 1,024 tokens per reply, 4 minutes per call, no retries.
- Session
- Four calls: the scenario, then Recommendation, Rationale and Confidence.
Dependent Variable
Do you recommend adopting Plan A?
Yes / No
Our dependent variable of interest is the percentage of valid responses selecting Yes to recommend Plan A in each condition.
Procedure
2Execute

3Analyze
FRAME-01: Does a gain or loss frame affect what a model endorses?
Yes

Note. N = 200 preregistered confirmatory sessions, n = 50 per condition, every one analysed. Percentages are sessions recommending Plan A. Error bars are Wilson 95% confidence intervals. Brackets mark the comparisons the registered tests found significant.
Study AGENT-EE7FF17DBD5EE72B744DF50BABD9707A. Registration hash sha256:0011b440d41d20edfe5a48978853d12aa926cbb3d5edc43de7d0728f6ae7cd69. Result digest sha256:0be67aac147c0ed153830757b38016080ed8d6274d94677a37b90dddff223b22.
4Replicate
A recorded study can be replicated from its own registration. FRAME-02 replicated FRAME-01 through OpenPsy with 320 preregistered sessions in two samples and one hypothesis per model.
FRAME-02: Does the endorsement effect replicate in a larger study?
Yes

Note. N = 320 preregistered confirmatory sessions in two samples, n = 80 per condition (40 per sample). Five sessions that ended in an ambiguous provider call were excluded as missing under the registered rule, so the analysed n is 80, 79, 77 and 80 for Gain frame with Claude Opus 5, Gain frame with Claude Sonnet 5, Loss frame with Claude Opus 5 and Loss frame with Claude Sonnet 5. Percentages are sessions recommending Plan A. Error bars are Wilson 95% confidence intervals. Brackets mark the comparisons the registered tests found significant.
Study AGENT-B9FB8AA2D19BF8FF15BAD36154CCC6E6, registered under the title FRAME-01 as version 5 of the same experiment. Registration hash sha256:f624c956ecbb04e2188b775389c976e5f6c2c53611f9fe2c2dbda82bdec363de. Result digest sha256:2cf4606819ed0233e4169b555ea69cce5410459762c9b08c0ac48c76ac10a0a0.
See FRAME-02 here. FRAME-02 has its own page with each sample, the effect sizes and the record of the run.
5Research
After obtaining results, progress your research programs to better understand phenomena through subsequent experimentation.
FRAME-03: Does the frame change how strongly a model endorses, not just whether it does?
Yes


Note. N = 160 preregistered confirmatory sessions in two samples, n = 40 per condition (20 per sample). Four sessions that ended in an ambiguous provider call were excluded as missing under the registered rule, so the analysed n is 37, 40, 39 and 40 for Gain frame with Claude Opus 5, Gain frame with Claude Sonnet 5, Loss frame with Claude Opus 5 and Loss frame with Claude Sonnet 5. Each cell gives the mean likelihood of recommending Plan A on the 1 to 7 scale with its SD and n, and the mean confidence rating. Error bars are the recorded 95% confidence intervals of the means. Brackets mark the comparisons the registered tests found significant.
Study AGENT-4077193D973E70CDF2A39DCC053D80C5. Registration hash sha256:b2ce589e323d8aa833f3176065b5f1bdae33cb59eae3050644d58627aa926b8a. Result digest sha256:d4a4431898f3834d01808cfc4c8801e432b30628f92df89841c7d65182ae2336.
See FRAME-03 here. FRAME-03 has its own page with every outcome, each sample and the record of the run.
FRAME-04: Do the endorsement effects extend to the newest Sonnet model (5.5)?
Yes, but with some differences.


Note. N = 160 preregistered confirmatory sessions in two samples, n = 40 per condition (20 per sample). One session that ended in an ambiguous provider call was excluded as missing under the registered rule, so the analysed n is 39, 40, 40 and 40 for Gain frame with Claude Opus 5, Gain frame with Claude Sonnet 5.5, Loss frame with Claude Opus 5 and Loss frame with Claude Sonnet 5.5. Each cell gives the mean likelihood of recommending Plan A on the 1 to 7 scale with its SD and n, and the mean confidence rating. Error bars are the recorded 95% confidence intervals of the means. Brackets mark the comparisons the registered tests found significant.
Study AGENT-C218672F0B8877E662FF844F30FFC381. Registration hash sha256:6919c277f77e926c8e9719c7e6ba8ce148ada5cf08fdf370c78f12c48add26cb. Result digest sha256:557362dfff53858ebb0af0f072f0e29d4622afdcf39612ff7610c1b972577e95. Software release c761c27d.
See FRAME-04 here. FRAME-04 has its own page with every outcome, each sample and the record of the run.
FRAME-05: Is the same effect present in ChatGPT's Terra and Sol?
Yes, in the available exploratory results.


Note. N = 160 planned sessions in two samples, with 40 per condition (20 per sample). Both Gain cells contain 40 analysed sessions and both Loss cells contain 39. Two sessions remain missing. Each cell gives the mean likelihood of recommending Plan A with its SD and n, and the mean confidence rating. Error bars are newly calculated individual unadjusted 95% Student-t confidence intervals of the means, using n − 1 degrees of freedom as in FRAME-04. Pairwise significance brackets use Holm-adjusted p values; the main effect of Frame uses its unadjusted omnibus p. The intervals do not account for missingness, outcome-informed recovery or provider dependence.
FRAME-05 verified export sha256:1a3430c1bd216c30bd13c6374a1d07887f21b691b61d1619e6f6e84ad6071c97. Exploratory analysis sha256:0e422625c52a7c8a2cd92220b704ddca44f19efdb9906329f6b3c41466358c44. Mean confidence intervals calculated separately for this presentation.
FRAME-05: the OpenAI replication. FRAME-05 has its own page with every outcome, each sample, statistical comparisons, independent double coding and the record of the run.
FRAME-06: Does Opus 5's confidence effect depend on the Claude Code version?
Not reliably. It appears on 2.1.281 and is weaker on 2.1.233.


Note. N = 160 preregistered confirmatory sessions in two samples, n = 40 per condition (20 per sample), and every session was analysed. Each cell gives the mean likelihood of recommending Plan A on the 1 to 7 scale with its SD and n, and the mean confidence rating. Error bars are the recorded 95% confidence intervals of the means. Brackets mark the comparisons the registered tests found significant.
Study AGENT-552121A995F2670603D9B626FADAF1BB. Registration hash sha256:e412722ca3078cc058354151ab8a9677888e37b1f9b0981fa719e9658dbe806c. Result digest sha256:6363aa6402da40c79a6aee3f80273f63edeb6a06228d1bf3e9c2c7ea5ec441d8.
See FRAME-06 here. FRAME-06 has its own page with every outcome, each sample and the record of the run.
PRICE-01: Does a gain or loss frame change what a model will pay?
Yes, for both models, and much more for Opus 5.


Note. N = 160 preregistered confirmatory sessions in two samples, n = 40 per condition (20 per sample). Six sessions had a provider call that ended ambiguously and was not resent, five in Gain frame with Claude Opus 5 and one in Gain frame with Claude Sonnet 5.5. Three of them, all in Gain frame with Claude Opus 5, have no price, so the analysed n is 37, 40, 40 and 40 for Gain frame with Claude Opus 5, Gain frame with Claude Sonnet 5.5, Loss frame with Claude Opus 5 and Loss frame with Claude Sonnet 5.5. The likelihood to buy is analysed for 156 sessions, 37, 39, 40 and 40 in the same order. Each cell gives the mean maximum price in US dollars with its SD and n, and the mean likelihood to buy. Error bars are the recorded 95% confidence intervals of the means, and the dashed line marks the 25 dollar reference. Brackets mark the comparisons the registered tests found significant.
Study AGENT-533F088A363F01BBCC4F5B9A6C65D539. Registration hash sha256:77908dbd91d1e31193d70fa4ffe8546b904ed016b4c65b1d751e5e8bf8032f0e. Result digest sha256:478427129010254bdc2fbc1f3a1c6e088f789635b5972309574866f994bd6b0e.
See PRICE-01 here. PRICE-01 has its own page with every outcome, each sample and the record of the run.
PRICE-02: Does the price-framing effect replicate with Sol and Terra?
Yes, for both models; their price-framing effects do not differ significantly.


Note. N = 160 scheduled main sessions in two samples of 20 per condition; 153 complete sessions were eligible and seven known protocol failures were retained without replacement. Analysed n is 39, 37, 39 and 38 for Sol gain, Terra gain, Sol loss and Terra loss. Each cell gives maximum price in US dollars, on the range from 0 to 60, with its SD and n. Likelihood to buy on the 1–7 scale is reported on the study page. Error bars are individual, unadjusted 95% Student t confidence intervals of the means with n − 1 degrees of freedom; the dashed line marks the $25 reference. Four pooled pairwise brackets come from sample-stratified exact permutation tests with the complete Holm correction family across all four comparisons: * p < .05, ** p < .01, *** p < .001. The line view has no stars; tests appear in the bar view and statistical tables. The native run used 1,024 tokens as an observed-length reference; no provider-enforced cap or truncation status was available. The study page lists all deviations.
PRICE-02 is the display name for native campaign PRICE01-SOL-TERRA-20261007. Numerical analysis content digest sha256:a926f9489071713b43eafe086008a1e5c580c481d3f116afd3546fa7ae377a13. PRICE-01 remains the separate original Opus/Sonnet study.
See PRICE-02 here. PRICE-02 has its own page with every available numerical outcome, each sample, inferential statistics, downloads and the record of deviations.
PRICE-03: Does the price-framing effect replicate at twice the sample size?
Yes, for both models; their price-framing effects do not differ significantly.


Note. N = 320 scheduled main sessions in two samples of 40 per model and frame. Of these sessions, 317 were eligible, one ended in a known failure and two original sessions remain unresolved: one accepted HTTP 503 stream disconnection and one accepted stream disconnection with no HTTP status. These technical-missing sessions supply no scientific outcomes, and a missing HTTP status is not classified as 503. All 84 scheduled pilot slots are excluded. The analysed n is 80, 80, 78 and 79 for Gain frame with GPT-6 Sol, Gain frame with GPT-5.6 Terra, Loss frame with GPT-6 Sol and Loss frame with GPT-5.6 Terra. Each cell gives the mean maximum price in US dollars with its SD and valid n; the totals pool the valid observed outcomes, and missing outcomes are never scored as zero. Sample sizes are omitted from the graph panels. Error bars are individual, unadjusted 95% Student t confidence intervals of the means; they are not simultaneous and do not determine the registered verdicts. The dashed line marks the 25 dollar reference. Brackets mark the comparisons that the pooled tests found significant within the complete four-comparison Holm family: * p < .05, ** p < .01, *** p < .001. The line view has no stars. The native route did not enforce or verify a 1,024-token reply cap, and the study page lists all deviations.
PRICE-03 is the display label for native target PRICE03-SOL-TERRA-20261007-E2, collected as the amended stream-disconnection residual continuation. Analysis seal sha256:a8bb0432c101ec03b5453c29ff40bc0074f5e8f4ad0ea4ba7f68d90fbdec9d9b. Collection seal sha256:7cb1c2d50725b3dbe4e5b4feee4c596b5ede638742d5941388f4030bbc84bbf2. PRICE-01 and PRICE-02 remain separate studies.
See PRICE-03 here. PRICE-03 has its own page with every outcome, each sample, inferential statistics, downloads and the record of deviations.
OpenPsy Roadmap
OpenPsy is in internal closed alpha. The example study on this page was run with language models as its participants, and no human participant has taken part in an OpenPsy study.
In Progress (Expected Live Q4 2026)
- A researcher can create an experiment, build it as a graph from Library blocks, edit each block's wording, and save every change as a new version.
- Any two saved versions can be compared, and the differences are written out as sentences.
- Library wordings are stored as exact versions, and publishing a revision leaves existing experiments on the version they used.
- A scripted test participant can take an authored study from consent to completion on a phone-sized screen.
- Automated evals pre and post execution
Near Future
- Export and replication of experiments by third parties
- Automated Measure and Execution Pilot Workflows
- Automated Power Analysis
- Co-Pilot Assistant in application.
- Hybrid Human/Agent Experiments
Source Code
The source code, the specification and the product documentation are being prepared for publication on GitHub.
GitHub repository opening soon